This is a new announcement banner that can be turned on and off

Table of Contents

How to build a loan portfolio tracking spreadsheet

A loan portfolio tracking spreadsheet provides a centralized way to monitor multiple loans throughout their lifecycle. It brings together essential details such as borrower information, loan balances, interest rates, payment schedules, and maturity dates into a single worksheet, making it easier to review the status of each facility. 

TL;DR

  • A loan portfolio tracking spreadsheet keeps tabs on lending details, borrower information, and repayment progress across every loan in one place, typically through columns like loan ID, borrower name, original principal, interest rate, issue date, maturity date, outstanding balance, and payment status.
  • It can be built from scratch with standard spreadsheet formulas or started from a pre-made template, whether the use case is personal debt tracking or a broader commercial lending book.
  • This article covers which columns and formulas to use, how to build the sheet step by step, and where a manual spreadsheet starts to struggle once you’re tracking many loans across a team.
  • Termgrid’s Portfolio Management module takes over this tracking automatically, keeping every loan’s details in one place without anyone needing to update a spreadsheet by hand.

What is loan portfolio tracking

A loan portfolio tracking spreadsheet keeps tabs on lending details, borrower information, and repayment progress across every loan in one place, typically through columns like loan ID, borrower name, original principal, interest rate, issue date, maturity date, outstanding balance, and payment status.

Loan portfolio tracking is the practice of watching every loan a lender, fund, or sponsor holds, rather than looking at one loan at a time. It usually covers how much is owed to the fund which industries or facility types make up the book, when loans are coming due, and whether each one is meeting its terms.

The key difference from tracking a single loan is scale. One loan means one payment schedule and one set of terms to watch. A portfolio means holding many of those in the same format, so patterns like too much money tied to one lender, or several loans coming due in the same quarter, are easy to spot across the whole book instead of getting lost in separate files.

The difficulty isn’t simply the number of rows; it’s maintaining an accurate picture as facilities are amended, lender allocations change, covenants are tested, maturities approach and multiple people rely on the same information .

Columns to include in a loan portfolio tracking spreadsheet

A loan portfolio tracker needs the same set of columns on every row. At minimum:

  1. Loan ID and borrower name. A unique number for each loan, plus the person or business it belongs to.
  2. Principal amount and current balance. The original size of the loan, and how much is still owed.
  3. Interest rate and term. The rate charged, and how long the loan runs for.
  4. Key dates. When the loan started, when the next payment is due, and when it’s fully due to be paid off.
  5. Payment status. A simple label such as current, late, or paid off, chosen from a fixed list rather than typed freely.

Bigger portfolios often add a risk rating or a facility type as well. But these five groups are what make the rest of the tracker work, since summaries, filters, and maturity views all depend on this data being filled in the same way on every row.

Formula for a loan portfolio tracking spreadsheet

A few formulas turn the tracker from a plain list into something that actively watches the portfolio for you.

Formula

What it does

=PMT(rate/12, nper, -principal)

Works out the expected monthly payment for a loan, based on its rate, term, and principal.

=PV(rate/12, nper-paid_periods, -payment, future_value)

Updates the current balance automatically as payments are made, instead of typing in a new number each month.

=IF(TODAY()>due_date, “Overdue”, “Current”)

Marks a loan as overdue the moment its due date passes, without anyone having to check it by hand.

=SUM(balance_range)

Adds up the total amount still owed across the whole portfolio.

=SUMPRODUCT(balance_range, rate_range)/SUM(balance_range)

Works out the average interest rate across the portfolio, weighted so bigger loans count more than smaller ones.

Pair the overdue formula with conditional formatting so late loans highlight automatically, rather than someone having to scan the whole sheet to find them.

How to build a loan portfolio tracking spreadsheet in Excel

A loan portfolio tracker is fundamentally a structured list, not a calculation-heavy model. The goal is consistency across rows, since the value of the spreadsheet comes from being able to filter, sort, and summarize across every facility at once.

  1. Decide on one row per facility, not one row per borrower. A single portfolio company or borrower can hold more than one facility, such as a term loan and a revolver. Tracking at the facility level keeps the data accurate when that happens.
  2. Set a fixed set of columns and apply them to every row. At minimum: portfolio company or borrower name, facility type, lender, facility size, interest rate, maturity date, and covenant status. Add fees, allocation, or fund attribution if your portfolio spans multiple funds.
  3. Use data validation on categorical fields. Facility type, lender, and covenant status should pull from a fixed dropdown list rather than free text, so that filtering and summarizing later doesn’t break because of inconsistent spelling or naming.
  4. Add a summary tab that pulls from the detail tab. Use SUMIFS or a PivotTable to roll up total exposure by lender, facility type, or maturity year. This is what turns a flat list into something a team can actually use to spot concentration or timing risk, rather than just a record of individual loans.
  5. Add a maturity view. Sort or filter the detail tab by maturity date, or build a simple timeline chart, so upcoming maturities are visible without scanning every row manually.
  6. Decide who owns updates, and how often. A tracker is only as accurate as its last update. If more than one person updates different rows, agree on a cadence (monthly or quarterly, at minimum) and a way to confirm every row has actually been reviewed, not just left unchanged.

Loan portfolio tracking template for Excel

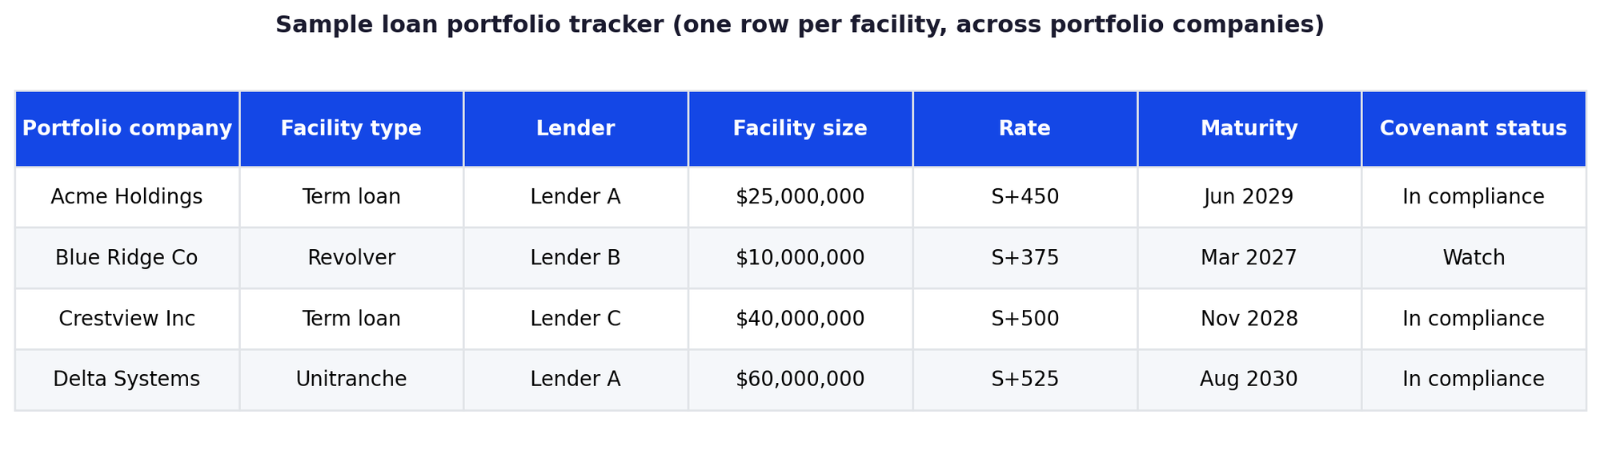
A basic template needs a detail tab with one row per facility, using consistent columns across every row. The image below shows what that looks like for a small portfolio spanning several borrowers and lenders.

 loan portfolio tracking excel

Notice that each row is a facility, not a company, and that covenant status is tracked as its own column rather than buried in a note. This is what makes the sheet usable for a quick answer to questions like “which facilities mature in the next two quarters” or “how much exposure do we have to a single lender,” without opening every underlying credit agreement.

A reusable version of this template should keep facility type, lender, and covenant status as dropdown-driven fields, and should separate the raw detail tab from any summary tab that rolls the data up, so the underlying data stays clean even as summary views change.

Why traditional loan portfolio tracking in a spreadsheet breaks down

A spreadsheet works well for a small number of facilities updated by one person. The problems tend to show up as two variables grow at the same time: the number of facilities being tracked, and the number of people responsible for keeping the file current.

  1. There is no way to flag a missed update. If a facility is amended, or a covenant test result changes, the spreadsheet only reflects that once someone manually opens the file and edits the relevant row. Nothing in Excel signals that a row is stale.
  2. Multiple people editing the same file creates version drift. Once more than one person updates different rows, or different team members keep their own copies, teams often end up with duplicated/offline trackers and fragmented processes.
  3. Covenant and maturity monitoring depends on someone remembering to check. A standard spreadsheet does not proactively alert the team when a covenant test date or maturity is approaching. That responsibility sits entirely with whoever owns the file, and it is easy for a date to slip by during a busy reporting period.
  4. The tracker and the underlying credit agreements can drift apart. Over time, small inconsistencies (a rate that was never updated after a repricing, a facility size that doesn’t reflect an upsize) accumulate, and reconciling the spreadsheet against the actual credit agreements becomes a larger and larger exercise the longer it goes unchecked.

None of these are failures of Excel as a tool. They are structural limits of tracking live, changing information in a static file that has no way of knowing when its own data is out of date.

Manual vs Automating with Termgrid

Tracking task

Handled manually in a spreadsheet

Handled automatically with Termgrid

Source of truth

One file, often duplicated across team members

One live record per portfolio

Maturity tracking

Requires manually sorting or filtering the sheet

Visible across the portfolio without manual review

Version control

Duplicated/offline trackers and fragmented processes

Single shared record, no competing copies

Scaling to more facilities

Manual reconciliation burden grows with each new facility

Same structure supports one facility or hundreds

The pattern across every row in this table is the same: a spreadsheet requires a person to notice that something changed and manually update the file. Termgrid’s Portfolio Management module removes that dependency by tying the tracked data directly to each facility’s current terms, so updates propagate without a manual editing step.

When Excel is not enough to track a loan portfolio

Excel remains a reasonable choice for a small number of facilities with infrequent changes, tracked by one or two people. It stops being enough once any of the following are true:

  1. You are tracking debt across more than a handful of portfolio companies or facilities.
  2. More than one person needs to update or rely on the tracker, and there is no reliable way to confirm which copy is current.
  3. Facilities are amended with any regularity, and each amendment requires a manual reconciliation against the credit agreement.
  4. Covenant testing depends on the same data as the tracker, and a mismatch between the two would create a real compliance risk rather than just a reporting inconvenience.
  5. Reporting to investors or a credit committee requires a portfolio-wide view that would otherwise mean stitching together several separate files.

Any one of these on its own might still be manageable in a spreadsheet. Several of them together are usually a sign that the operational risk of manual tracking has outgrown what a shared file can reliably support.

How Termgrid tracks a loan portfolio without the spreadsheet

Every issue described above comes down to the same root cause: a spreadsheet has no concept of a portfolio’s current state. It only knows what was last typed into it, and nothing in Excel checks whether that information is still accurate.

Termgrid’s Portfolio Management module is built specifically for tracking debt across a portfolio, rather than starting from a single-loan spreadsheet and scaling it up. A few things this changes in practice:

Every facility lives in one record, not one row in a shared file. Instead of a detail tab that someone has to keep synchronized, each facility’s terms, allocation, and covenant status are stored once in Termgrid’s capital structure module, visible to the whole team at the same time.

Covenant tests draw from the same data as the rest of the portfolio. Termgrid’s Covenants module ties directly to the capital structure record, so a covenant test and the underlying facility data cannot drift apart the way they routinely do across separate spreadsheet tabs.

Maturities and exposure are visible across the whole portfolio, not reconstructed by filtering rows. Because every facility is tracked in the same underlying structure, questions like total exposure by lender or upcoming maturities in a given quarter are answered directly rather than requiring a manual PivotTable refresh.

This reflects the same underlying problem this guide describes throughout: tracking debt across a portfolio in a spreadsheet works until it doesn’t, and the point where it stops working is usually where a dedicated system starts to pay for itself.

For teams still managing this in a spreadsheet today, the practical near-term step is the same one recommended earlier in this guide: fix your fields, assign clear ownership of updates, and treat every amendment as a full reconciliation event. That keeps a spreadsheet workable for longer, even if it isn’t a permanent solution for a growing portfolio.

Frequently asked questions

1. What is loan portfolio tracking?

It means keeping an eye on every loan a lender, fund, or sponsor holds in one place, rather than checking each loan separately. It usually covers how much is owed, who it’s owed to, when loans are due, and whether each one is being paid on time.

2. What should a loan portfolio tracking spreadsheet include?

At minimum: loan ID, borrower name, principal amount, current balance, interest rate, maturity date, and payment status. Larger portfolios often add a risk rating, fees, or which fund or lender the loan belongs to.

3. How often should I update a loan portfolio tracker?

At least once a quarter, in line with normal reporting. Update it right away, too, whenever a loan’s terms change or a payment is missed, so the tracker never falls too far behind reality.

4. Can Excel handle a large loan portfolio?

Yes, up to a point. There’s no limit on how many rows you can add, but the risk grows as the portfolio grows: more loans and more people updating the file both raise the chance that something gets missed or two people end up working from different versions.

5. What is loan-to-value (LTV), and why does it matter?

Loan-to-value compares how much is still owed on a loan to the value of whatever is securing it. It’s a simple way to see how risky a secured loan is, and adding it as a column turns a basic tracker into something that also flags risk, not just loan details.

End-to-end platform for private debt.

Run deals faster. Track covenants in real time. Strengthen portfolio oversight.

$1tn+
Debt financed on platform
$4.8tn
Client AUM
Stay in Touch

Stay in touch

Stay in touch with all of our latest updates and articles.