Direct lenders have seen a significant pick up in activity (and as a result in raised funds) over the last years, taking full advantage of the public market disruptions and increased volatility.
Public markets have seen a significant recovery in 2024 meaning many private deals were refinanced in the public space. However private credit continues to remain active, deploying capital and generating attractive returns. A sign that it is growing into an asset class of its own.
While there are many public commentaries looking at how lenders have flexed on terms or structures, at Termgrid we are in a unique position to look at whether there are other – more operational – factors at play.
With more than 18,000 active users on the platform and 1,100 institutions, the Termgrid platform is the largest private capital network globally.
Our data is based upon deals launched on the platform – and so reflects not only live data but also data across the market irrespective of whether deals have closed or been dropped.
It is a unique insight into how deals get done based upon the activity of top tier sponsors, lenders and advisors.
Sponsor strategy
Networks – and the referrals, co-investments or exclusive opportunities that come with them – forming an essential part of the private credit playbook. But what does that look like in practice?
We wanted to look at how lenders operate in their network to ensure that they are shown new deals. We measured this by looking at how many sponsors they interact with on Termgrid – irrespective of whether these deals complete. This data is based upon the activity of a group of 30 direct lenders which broadly represent the top 30 funds globally.
For comparison we have drawn a subset of this data for a pool of lenders which reflects – but is not exactly – the top 10 lenders globally.
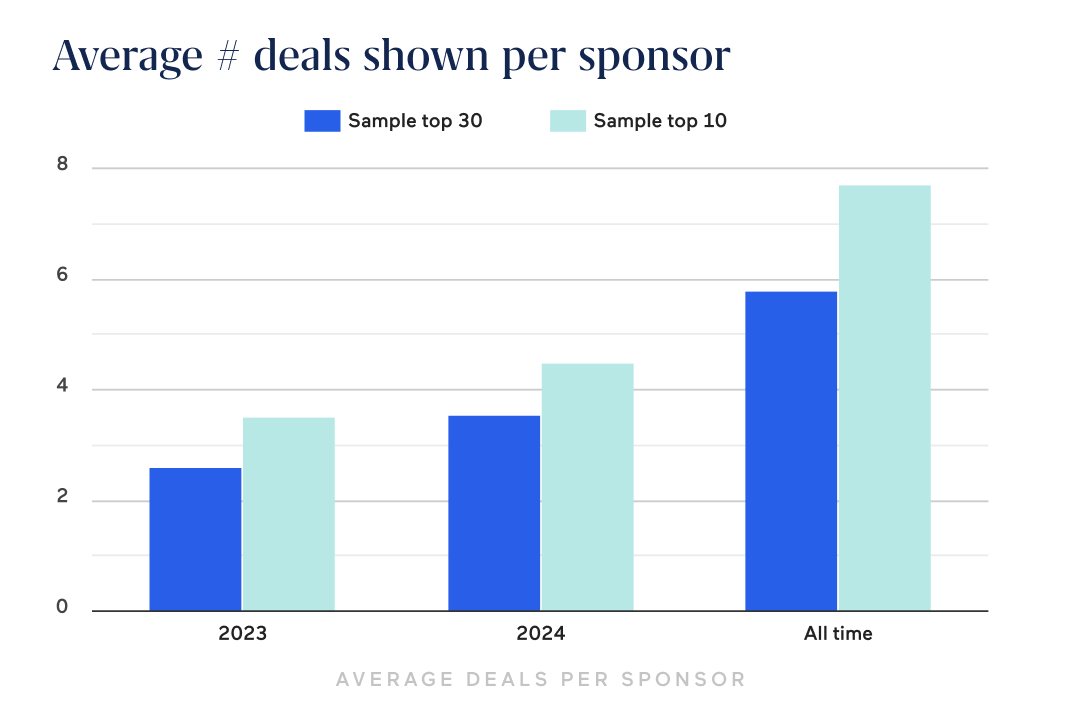
When looking at figures for 2024, our top 30 were shown an average of 3.6 deals by each Sponsor. This compares with 2.6 deals per Sponsor in 2023 when deal volumes were significantly lower.

In a reflection of how deal activity is still lagging behind pre-2022 figures, this figure compares with a figure of 5.8 deals per Sponsor for all deals historically.
In comparison our sample representing the top tier lenders, saw an average of over 4.5 deals per Sponsor. Even in the deal making desert of 2023, the top tier lenders were shown an average of 3.5 deals per Sponsor.
It is also clear that the top tier lenders interact with a higher number of sponsors. When looking at the all time figures on Termgrid, this additional sponsor network for the top tier represents 45%. This gap doubled in 2024, meaning that the top tier of lenders interact with twice as many sponsors as even the top 30.
It is clear that the top tier have an advantage in their sponsor network. Is the widening seen in 2024 a reflection of a competitive market with more lenders vying for business. Could it represent sponsors widening their networks in a bid to achieve advantageous terms.
As 2025 gets underway, we will keep an eye on the trends to see how this is playing out. Make sure you sign up for our insights to get updates on this and other topics.
Stay in touch with all of our latest updates and articles. Sign up now.


